


|
|
|
This article originally appeared on LinkedIn. I keep reading company press releases crowing about their Net Promoter Scores in the 80s and 90s—and I just shake my head in dismay. Don’t people understand that when the company sends a survey request to its customers, their promoters are most likely to respond, so the resulting Net Promoter Score using self-administered surveys are usually grossly inflated? The sample of respondents looks nothing like their overall customer population. If you care about “real” NPS results (that can be compared to those of other firms), then you must utilize a third-party expert that uses double-blind techniques. The most reliable of the firms providing such Net Promoter Score benchmark data, I believe, is a relatively new firm backed by Bain & Company called NPS Prism. The chart below shows the NPS leader’s performance in 14 different industry segments. The scores earned by the most customer-centric firm in each segment range from 30 in the Internet provider category (T-Mobile) all the way up to 79 for the leader in automobiles (Lexus).
Figure 1
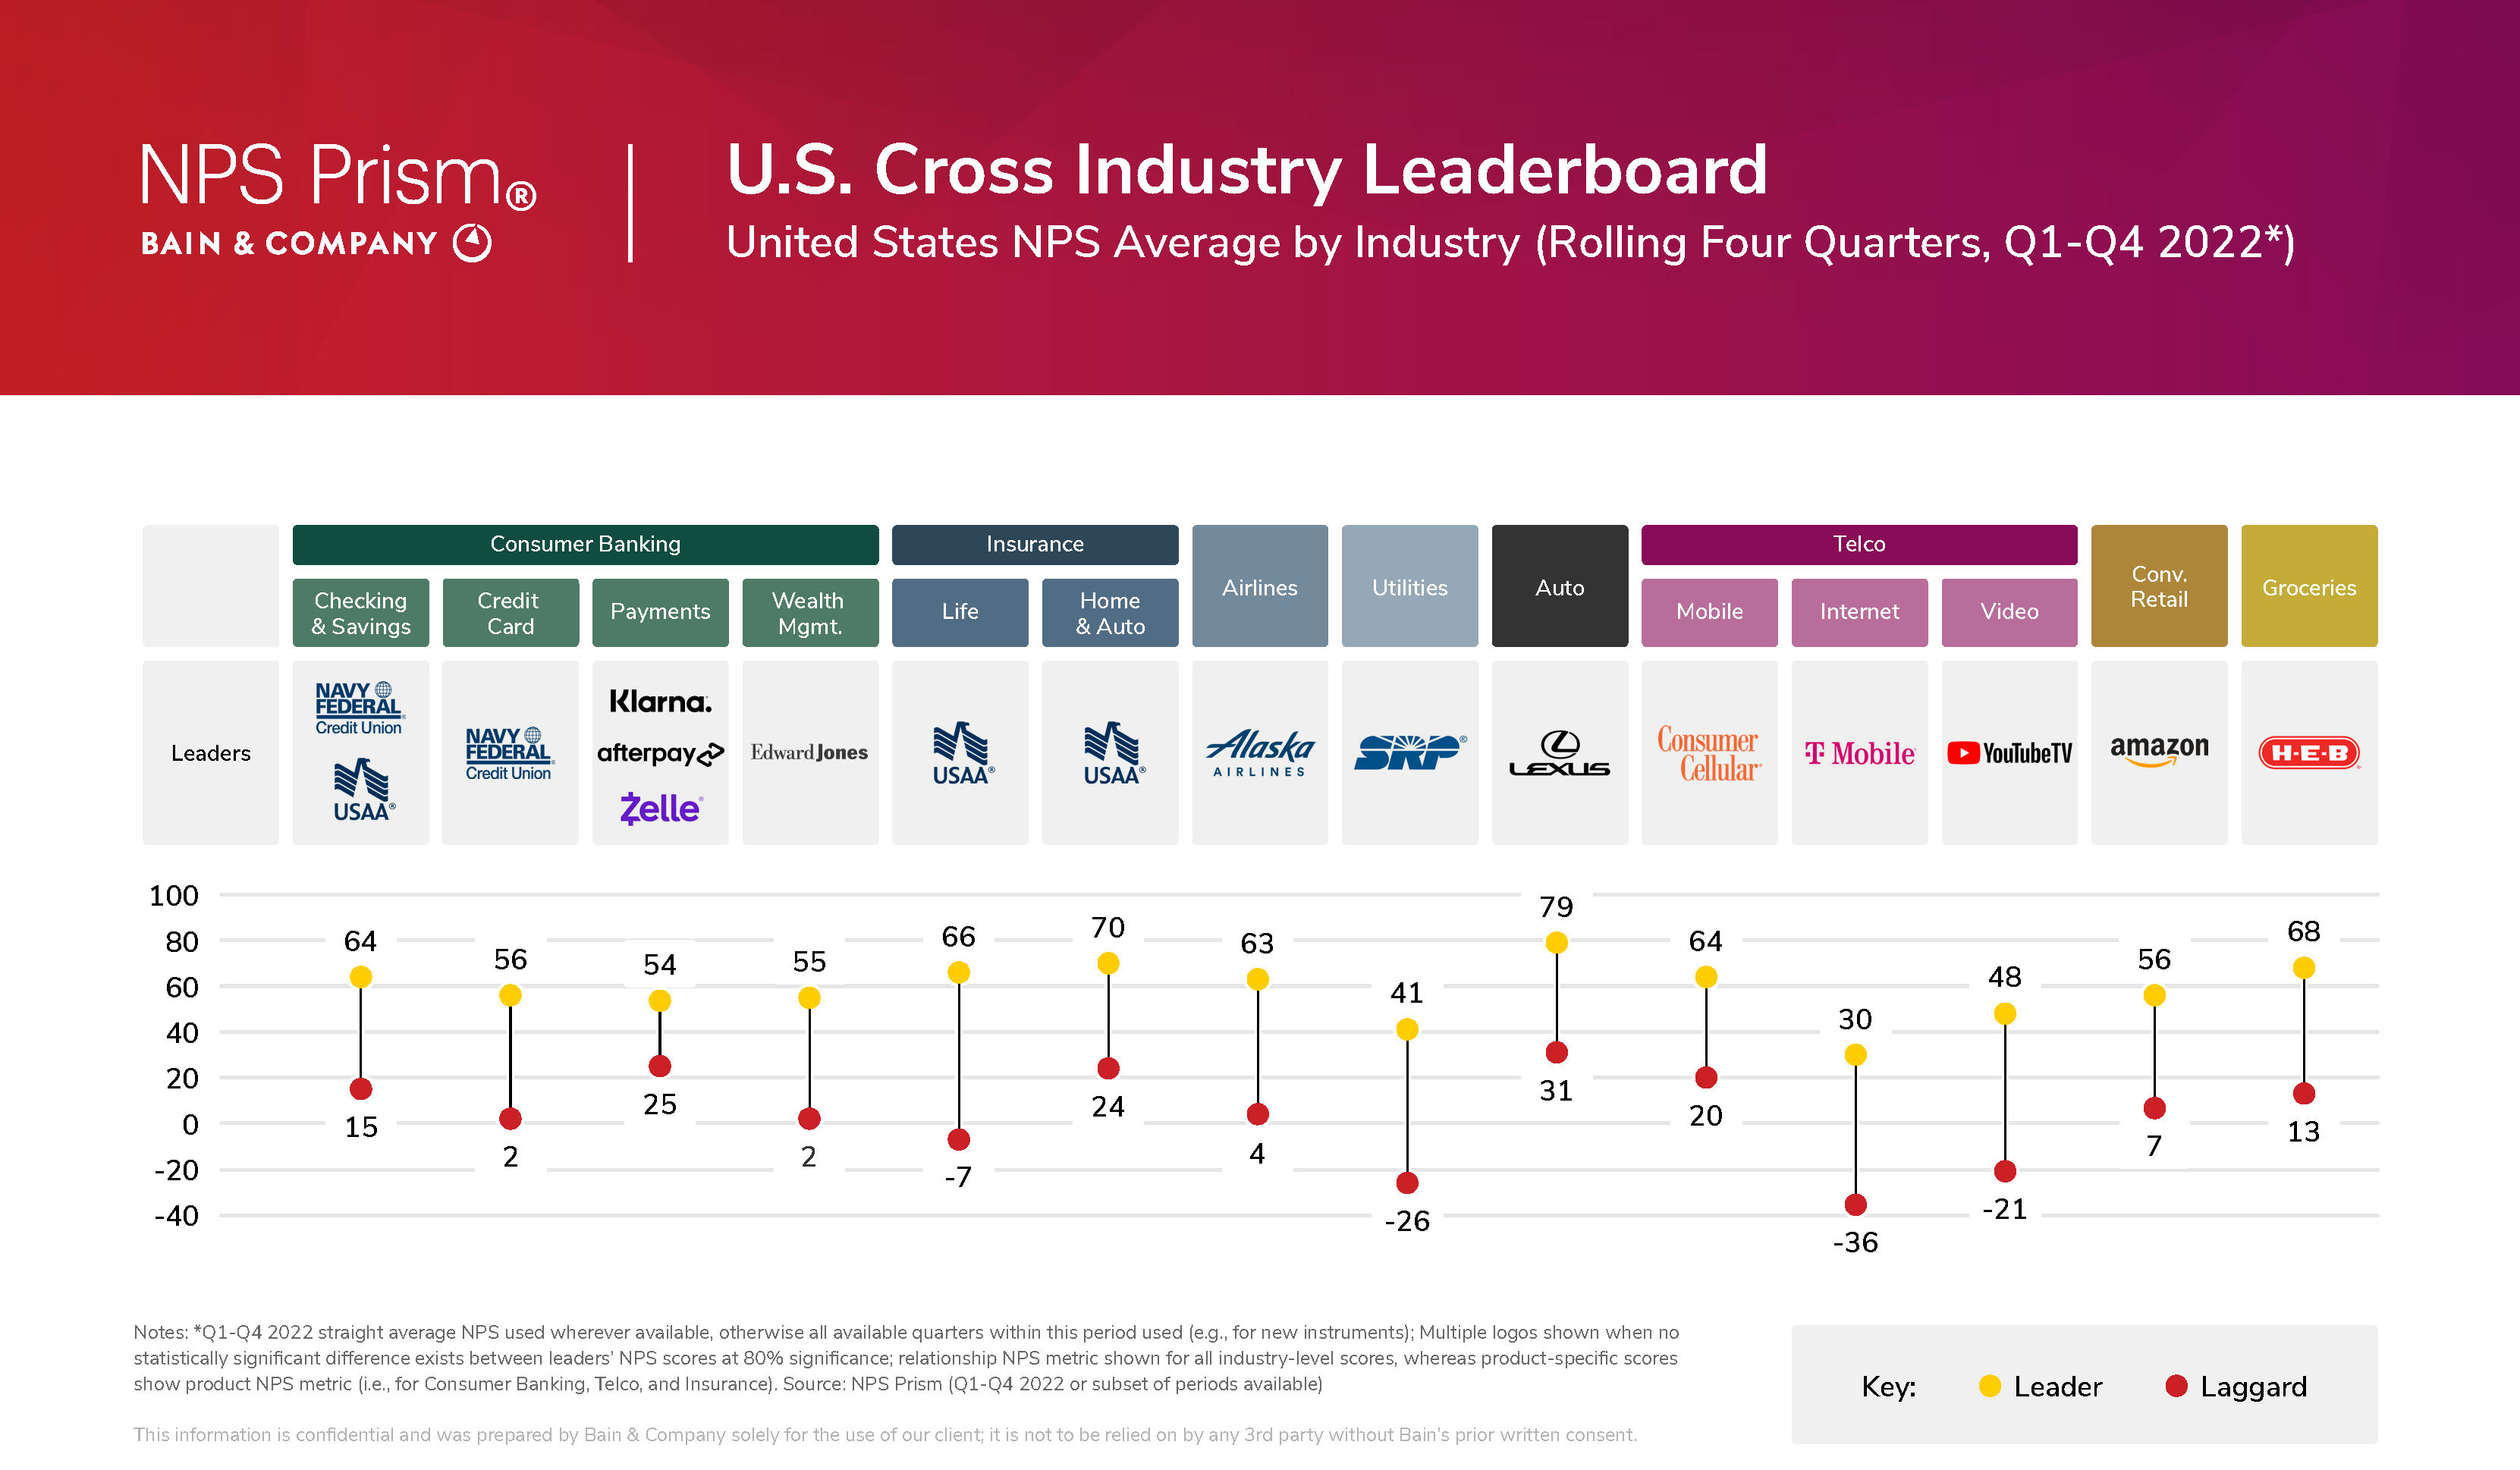
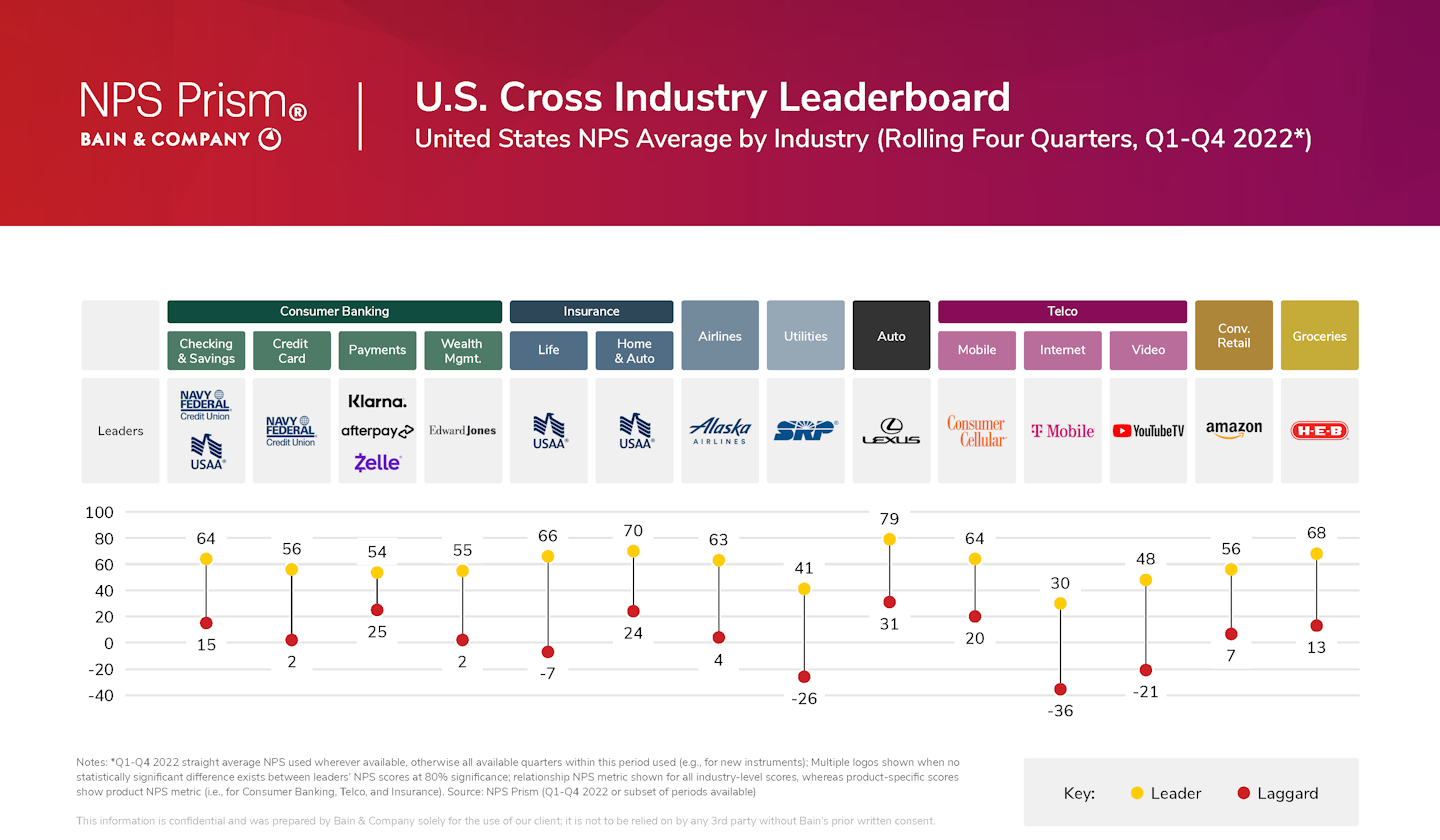
The range of scores within each industry is remarkable—for example, USAA leads life insurance with a score of 66, while the least customer-centric of its competitors polls at minus 7! In four industries—utilities, life insurance, Internet, and video providers—laggards earn negative Net Promoter Scores. Getting such accurate, apples-to-apples comparison takes serious effort. As we explained in Chapter 5 of Winning On Purpose: “… seemingly small changes in survey techniques can drive large changes in scores—things such as the timing of the survey request, the wording of the email’s subject line, the choice to embed the survey in the body of the email versus requiring a click-through, the implication that the score will have a direct impact on an individual employee, the decision as to whether to run the score from 0 to 10 or 10 to 0, and so on. All of these factors can have a substantial impact on who bothers to respond to the survey and how they score it.” That’s why consistently and properly gathered competitive data is so valuable. NPS Prism subscriptions cost a fraction of what it would cost companies to generate comparable data and insights on their own. Prism’s panels of customers are so large—most of them survey more than 20,000 consumers per quarter—that in addition to gathering precise brand-level (or relationship-level) Net Promoter Scores for each competitor, Prism also breaks the customer journey into its key components or episodes and reports them quarterly so firms can gauge progress and test the impact of new initiatives. A car purchase, for example, would include researching a vehicle online, shopping at a dealer, doing a test drive, purchasing or leasing with or without a trade-in, purchasing or extending a warranty, and so forth. Even NPS leaders have much to learn from this data. In many industries, that leader gets the top score in only a few of the dozen or so episodes that make up the customer journey. There’s plenty to learn from the top-performing competitor in each episode, and from other industry leaders. The Prism data helps keep leaders humble, which is vital for continued progress and innovation. I hope that Prism continues to share more leaderboard information. It will help all of us develop a clearer picture of where we should buy, where we should work, and where we should invest. And it will help company executives and boards of directors understand where they should invest and which firms are truly earning the highest loyalty from their customers. Those are the ones that will benefit from customers who come back, buy more, and refer their friends—the miraculous flywheel of earned growth. |
julio 11, 2023